Project
Investigation of the 3D Instationary Flow in Linear Turbine Cascade Using Large Eddy Simulations
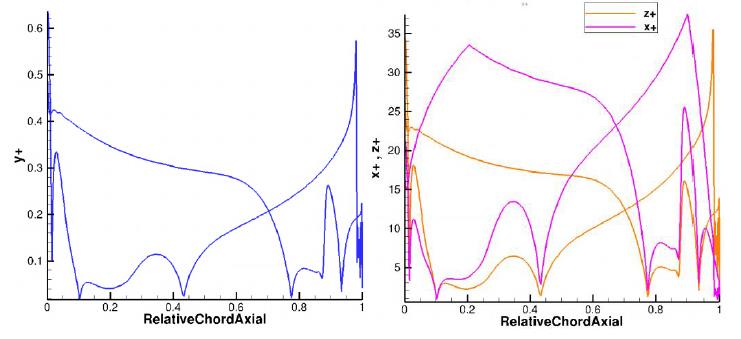 Figure 1: Non-dimensional cell sizes of Mesh 2.
 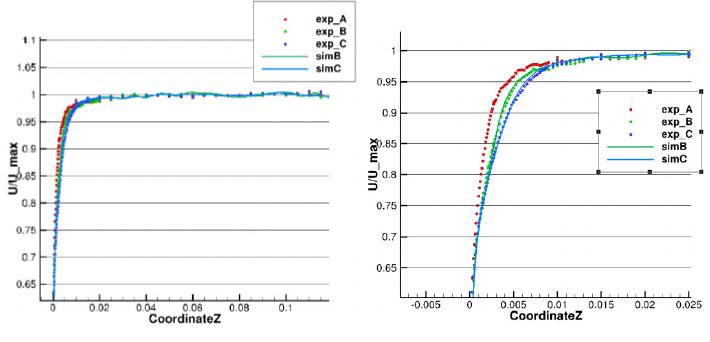 Figure 2: Velocity distribution at the inlet of the simulation domain and experimental data at three different axial positions. The figure on the right shows the normalized distribution of the velocity across the boundary layer.
 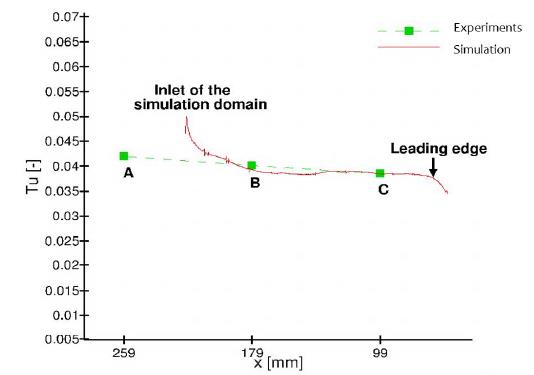 Figure 3: Turbulent intensity decay of the simulation and the corresponding experimental values.
 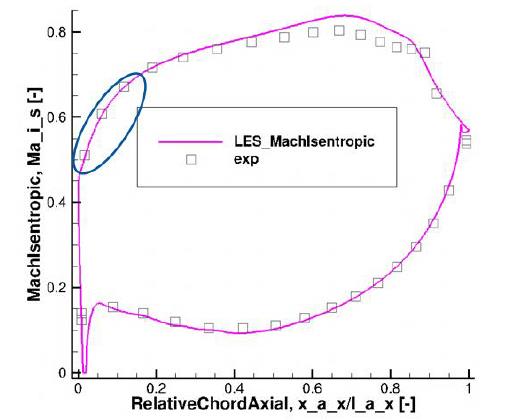 Figure 4: Distribution of the isentropic Mach number on the blade profile based on LES and measurements.
 Introduction: The shortcomings of cascade experiments and the promising capabilities of scale resolving simulations (SRS) is the driving force of a joint numerical and experimental project, which aims at investigating the capability of different SRS methodologies to predict the flow field in turbomachinery components. The findings of this project can be used threefold: 1. To calibrate the RANS turbulence models; 2. To gain a better understanding of the of turbomachinery flow physics including secondary (near-wall) flow, and therefore enable designers to develop more sophisticated designs and improve the performance and efficiency of turbomachinery; and 3. To quantify the capability of different SRS methods in terms of prediction accuracy vs. required computing resources. The generated database is the basis for deriving a guideline for the future use of SRS for cascade flows to supplement measurement data or, in the long term, to replace costly measurements.
Project Details
Project term
November 1, 2021–November 1, 2022
Affiliations
RWTH Aachen University
Institute
Institute of Jet Propulsion and Turbomachinery
Principal Investigator
Methods
Methods: In the current computing project we analyzed the three-dimensional turbulent flow of a highly loaded 3D low pressure turbine cascade at Reynolds number 200,000 via wall resolved LES using the wall adaptive local eddy viscosity (WALE) subgrid stress model. WALE is a promising approach, which can be used without wall functions or global damping functions and accounts for both strain rate and rotational rate.
Results
Results: The results presented within this status report were achieved between 11.2021 and 12.2022. An extension of the project is applied for and confirmed.
Subproject 1: In the first subproject a mesh study was performed to assure a suitable discretization in order to capture the transition mechanism, separation and reattachment. The experience from previous projects (identical/comparable turbine profile at 𝑅𝑒 = 90,000 in 𝑗𝑎𝑟𝑎0217) showed, that the suggestions regarding the mesh resolutions in the literature are not satisfactory for the configuration investigated in this project. For this purpose, two mesh resolutions were investigated for the operating point 𝑅𝑒 = 200,000:
o 𝑀𝑒𝑠ℎ 1: ~280 𝑚𝑖𝑙𝑙𝑖𝑜𝑛 𝑐𝑒𝑙𝑙𝑠 → 1.3 𝑚 𝑐𝑜𝑟𝑒−ℎ
o 𝑀𝑒𝑠ℎ 2: ~392 𝑚𝑖𝑙𝑙𝑖𝑜𝑛 𝑐𝑒𝑙𝑙𝑠 → 2.1 𝑚 𝑐𝑜𝑟𝑒−ℎ
Fig. 1 shows the non-dimensional cell sizes on the profile at the centerline for Mesh 2. Due to stability issues Mesh 2 needs a smaller physical timestep than Mesh 1 (1∗10−8𝑠 instead of 2∗10−8𝑠).
For the further investigations Mesh 2 was used.
Subproject 2: In the second subproject the boundary conditions at inlet were iteratively adjusted so that the incoming boundary layer profiles of the simulation matches the experimental data.
The inlet profile is given as mean total pressure (𝑃𝑡), mean total temperature (𝑇𝑡) and mean flow angles (𝛼,𝛽) at 0.087 𝑚 upstream of the profile leading edge. At the span wise centerline the operating conditions need to be fulfilled according to the measurements. The conditions at the centerline are extruded towards the sidewalls until the sidewall boundary layer is reached. Within the sidewall boundary layer, the total pressure is scaled down according to the boundary layer profile. All conditions are constant in pitch wise direction. The total pressure is adjusted so that the velocity profile in the boundary layer as well as at the centerline matches the measurements. The values at the centerline are responsible for keeping the operating point. The values in the boundary layer are chosen in a way, so that the boundary layer thickness matches the experimental data.
Fig. 2 shows the velocity distribution at two axial positions (denoted by B and C) in the inflow channel of the simulation domain (solid lines). Additionally, the corresponding measurements (symbols) are plotted at three axial positions (denoted by A, B and C) in the inflow channel. We can see that there is a very good match regarding the velocity at the centerline and the boundary layer thickness.
Fig. 3 shows the turbulent intensity measured at the centerline in three different axial positions (denoted by A, B and C) and the corresponding simulation result (solid line). We see a very good match regarding the turbulent decay (the slope of the curve) and the turbulent intensity value at the measured position B and C.
Subproject 3: The results achieved within this computing period do not match very well with the experimental results regarding the pressure distribution at the centerline (see fig. 4). This mismatch can be due to convergence.
Not converged simulations: In order to judge the convergence of a scale resolving simulation, first of all, the operating point should be reached and held. Additionally, for the LES calculations, at least the first and second order moments (in the sense of turbulent statistics) should be converged. The first order statistics are also responsible for the representation of the pressure distribution. The reduced timestep (half of the estimated timestep) results in a longer time of convergence, so that the results achieved until now are not converged and therefore do not represent the experimental results.
Fig. 4 shows on the other hand a good match regarding the inflow angle. This is evident by the very good match of the first experimental points on the suction side (see highlighted region in fig. 4 left). The deviations start to grow from about 50 % axial chord. Specially the maximum peak on the suction is not predicted very good via LES. In the simulation we see a higher isentropic Mach number (lower pressure values) and therefore the size of the separation bubble is reduced, when compared to experiments.
Discussion
The results presented in the previous section show the need for further investigation of the current test case. In the extension period of this computing project, the simulation of Mesh 2 will be further continued in order to reach a statistical convergence.
Additional Project Information
DFG classification: 404-03 Fluid Mechanics
Software: TRACE
Cluster: CLAIX
Publications
Nima Fard Afshar, et.al., “ASSESSMENT OF THE DDES-γ MODEL FOR THE SIMULATION OF A HIGHLY LOADED TURBINE CASCADE”, Boston, Submitted to ASME turbo Expo 2023