Project
Investigation of the 3D Instationary Flow in Linear Compressor Cascade Using Large Eddy Simulations
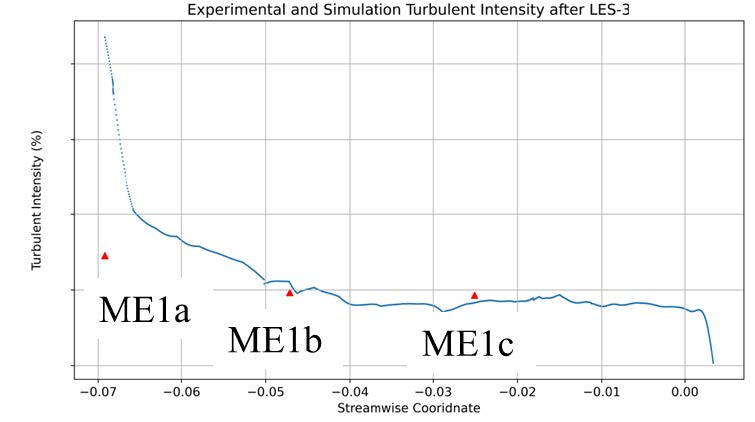 Figure 1: Experimental and simulation turbulent intensity decay after LES-3
 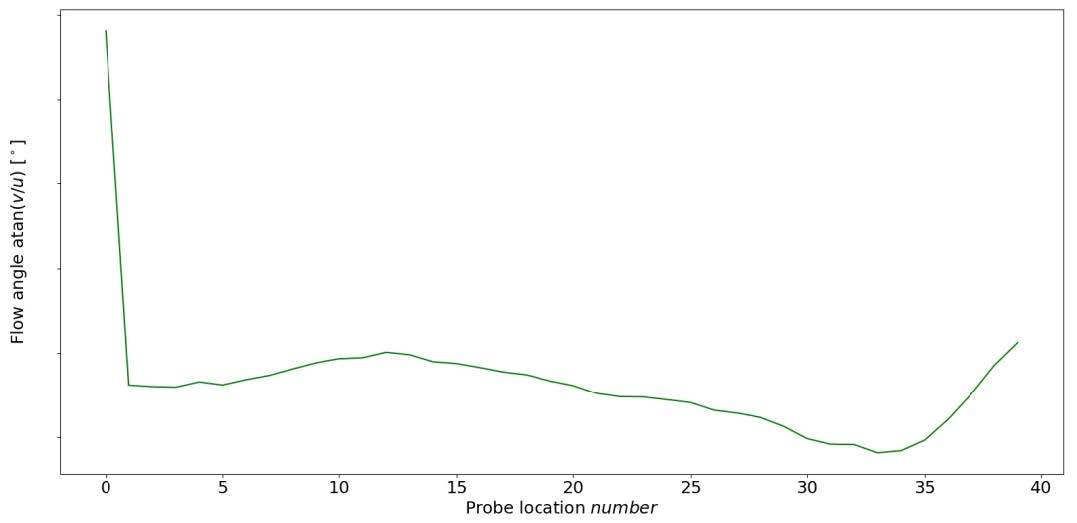 Figure 2: Variation of the simulated inflow angle in the inflow region
 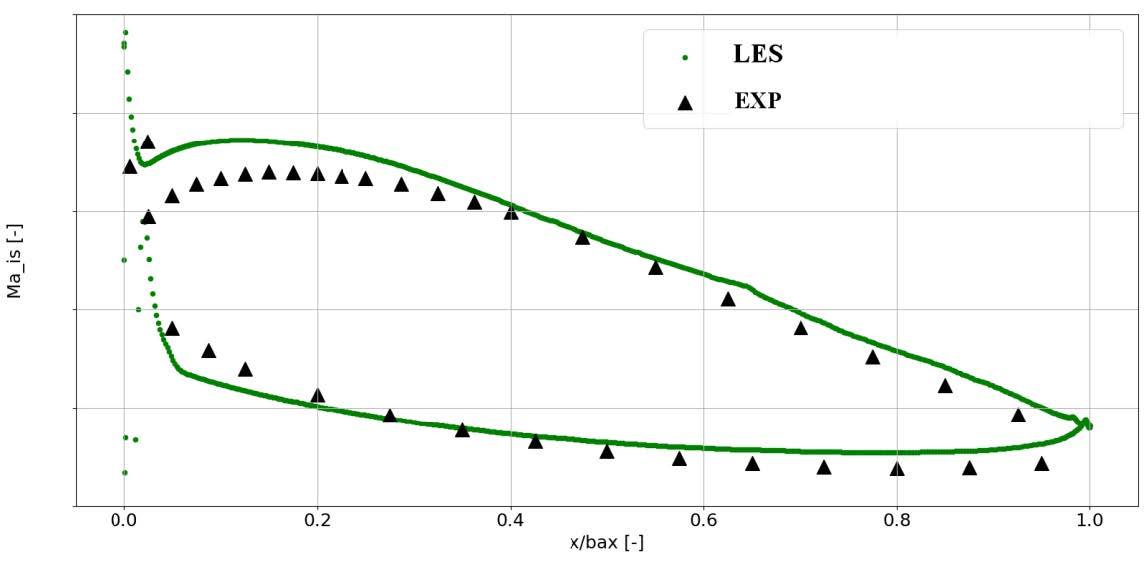 Figure 3: Distribution of the isentropic Mach number on the middle section of blade profile based on LES and measurements
 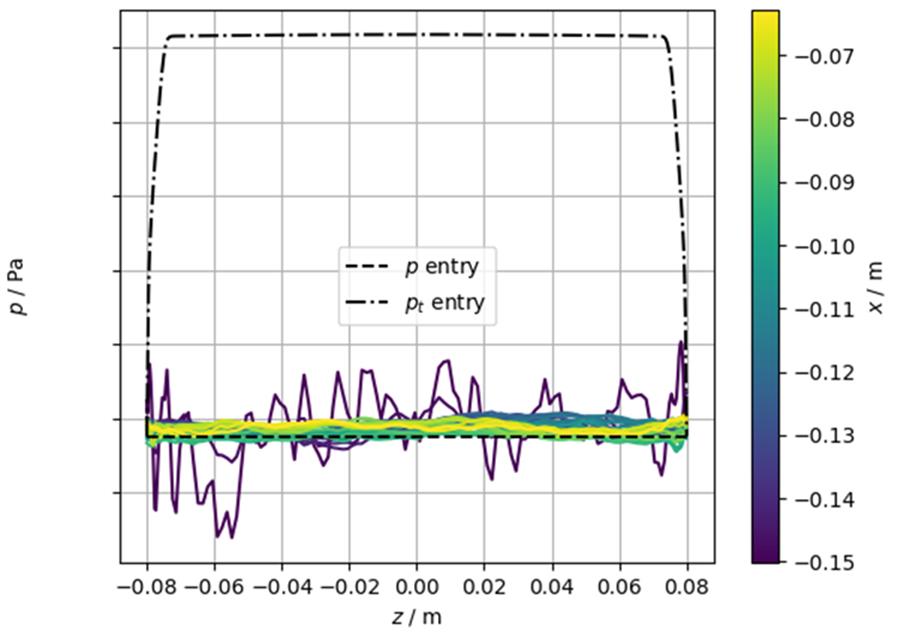 Figure 4: Originally prescribed radial pressure stagnation
 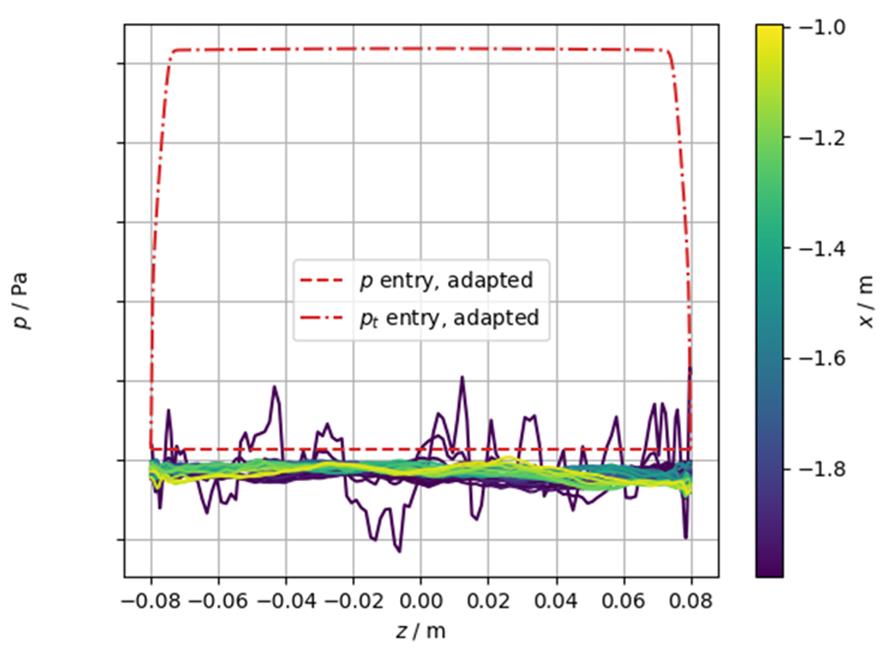 Figure 5: Adjusted radial pressure stagnation
 The shortcomings of cascade experiments and the promising capabilities of scale resolving simulations (SRS) is the driving force of a joint numerical and experimental project, which aims at investigating the capability of different SRS methodologies to predict the flow field in turbomachinery components. The findings of this project can be used threefold: 1. To calibrate the RANS turbulence models; 2. To gain a better understanding of the of turbomachinery flow physics including secondary (near-wall) flow, and therefore enable designers to develop more sophisticated designs and improve the performance and efficiencyof turbomachinery; and
3. To quantify the capability of different SRS methods in terms of prediction accuracy vs. required computing resources. The generated database is the basis for deriving a guideline for the future use of SRS for cascade flows to supplement measurement data or, in the long term, to replace costly measurements.
Project Details
Project term
May 1, 2022–May 1, 2023
Affiliations
RWTH Aachen University
Institute
Institute of Jet Propulsion and Turbomachinery
Principal Investigator
Methods
In the current computing project we analyzed the three-dimensional turbulent flow of a 3D high pressure compressor cascade at Reynolds number 490,000 via the code TRACE. In recent years, TRACE has been extended with a Discontinous Galerkin (DG) branch. In TRACE-DG, the governing equations are discretized with a nodal DG schemes, namely the Discontinous Galerkin Spectral Element Method (DGSEM), where a collocation of the interpolation and quadrature nodes is applied. The spatial discretization scheme is faced with the task of approximating all spatial derivative operators with a discrete representation. Discontinuous Galerkin (DG) methods combine the advantage of geometric flexibility, a locally adaptive resolution and the ease of higher-order approximations for this purpose. The spectral element approach requires a numerical grid consisting of hexahedral elements to span a tensor product space using Lagrange polynomials. The time integration, in this case, is performed using a third-order accurate explicit Runge-Kutta method. For the simulations of the past computing period the DGSEM is used.
Results
The results presented within this status report were achieved between 05.2022 and 05.2023. An extension of the project is applied for and confirmed.
• Subproject 1: One important factor to assure realistic turbomachinery flow conditions, beside the appropriate inflow and outflow boundary condition, is the generation realistic inflow turbulence. The correct boundary conditions in order to deal with the inflow turbulence and wakes leaving the domain has been investigated in the previous and ongoing computing projects (jara0217, rwth0555, p0020053). Within this sub-project the influence of the prescribed inlet profile has been investigated. In the literature the influence of the incoming freestream turbulence (FST) on the transitional processes on a compressor blade has been studied. It was found that the mode and location of the boundary layer transition is very sensitive to the FST intensity and as a consequence may have an important effect on the 3D corner separation in compressor cascades. Additionally, the 3D separation is also sensitive to the thickness of the incoming endwall boundary layer. Therefore, these two factors will be investigated within this sub-project. The inlet profile is given as mean total pressure (p_t), mean total temperature (T_t) and mean flow angles (α, β) at 0.065m upstream of the profile leading edge. At the span wise centerline, the operating conditions need to be fulfilled according to the measurements. The conditions at the centerline are extruded towards the sidewalls up to the edge of the sidewall boundary layer. Within the sidewall boundary layer, the total pressure is scaled down according to the boundary layer profile. All conditions are constant in pitch wise direction. The inlet flow profile (including the boundary layer profile) is compared against hot wire measurement data of the boundary layer available, measured at high speed linear cascade wind tunnel of the Institute of Jet Propulsion and Turbomachinery of the RWTH Aachen University. For LES, the inlet profiles include in addition to the variables outlined above, the mean velocity profile, turbulent length scales as well as the Reynolds stress components. All the above-mentioned parameters have been chosen and iterated in a way to satisfy the incoming turbulent intensity and turbulent boundary layer thickness. For this purpose, an available database of a spatially evolving turbulent boundary layer has been prescribed and is fitted to the boundary layer edge and the mid-flow channel with the available measurement data. In order to reduce the computational cost, this sub-project has only been performed on the inflow region upstream of the compressor cascade. This region represents a channel flow including end-walls. The inlet profiles have been iterated three times in order to match the experimental turbulent decay. Fig. 1 shows the corresponding results of the last LES and the comparison with the measurements.
• Subproject 2: The first sub-project was performed using FV-method. After changing to the DG-method we encountered some problems while dealing with the prescribed boundary conditions (extracted from sub-project 1), which were unforeseen. Therefore, we had to solve the problem iteratively by prescribing different boundary condition values and boundary condition methods, in which we changed the total pressure values in the boundary layer. This issue did require some additional resources, which were planned for simulating the baseline mesh (500 million cells). As a consequence, in the project extension we will focus on the coarse mesh with 280 million cells for the operating point Re = 490,000 and test two different boundary conditions.
The combination of the inlet profile (sub-project 1) and DG-method led to a backflow in the first cells and subsequently to unsuccessful simulations. In order to clarify this problem, several approaches have been investigated.
1. Global Values @ inlet panel
In the first step we prescribed global values boundary conditions at inlet plane (instead of radial distribution). Globally prescribed values did solve the backflow problem but do not satisfy two aspects.
1. A globally prescribed boundary condition is not optimal, since the detailed prescribed boundary layer values will be ignored (outcome of the sub-project 1).
2. As shown in Figure 2 the global prescription did solve the back flow issue but revealed another issue. Figure 2 shows that the prescribed inflow angle is not reproduced correctly. We prescribe the measured inflow angle but as can be seen in Figure 2 the inflow angle is not held correctly. As can be seen in Figure 3 the correct inflow angle is very important to match the operating point and experimental results. Figure 3 shows that because of the change in the inflow angle, the blade pressure distribution does not align with the experimental results.
Since the global prescription of the boundary values at inlet does not satisfy the requirements regarding matching the experiments. In the next step we changed the distribution of the boundary values at inlet from global values to a radial distribution, while iterating the total pressure to overcome the backflow.
2. Radial distribution + Riemann boundary condition
The problem with the backflow has been resolved iteratively, while changing the total pressure values near the sidewalls. The total pressure value at side walls was increased gradually while scaling the whole profile until freestream area in the middle of the channel.
Figure 4 shows the prescribed total pressure at inlet and the pressure values at the probes downstream of the inlet panel. The yellow and green lines show that in the near wall area the pressure within the domain is greater than the prescribed total pressure at inlet panel. That is the reason for the back flow in the near wall area.
Figure 5 shows the adjusted total pressure distribution at inlet. Such an adjustment did lead to a successful simulation without any backflow as can be seen by the total pressure and pressure values.
The adjusted total pressure distribution did solve the problem with the backflow but as shown in Figure 2 the problem with the inflow angle is still present. Therefore, in the next step the type of boundary condition was changed to characteristics.
3. Radial distribution + Characteristics boundary condition
The current simulations with an adjusted radial distribution and characteristics boundary condition show promising results. But the simulation needs more resources to statistically converge.
Discussion
The results presented in the previous section show the need for further investigation and simulation of the current test case. In the extension period of this computing project, the simulation of the setup chosen in the first computing period will be further continued in order to reach a statistical convergence.
Additional Project Information
DFG classification: 404-03 Fluid Mechanics
Software: TRACE
Cluster: CLAIX