Project
Assessment of compressible pressure-based CFD methods on hydrodynamic and hydroacoustic cavitation with focus on viscous and turbulence effects
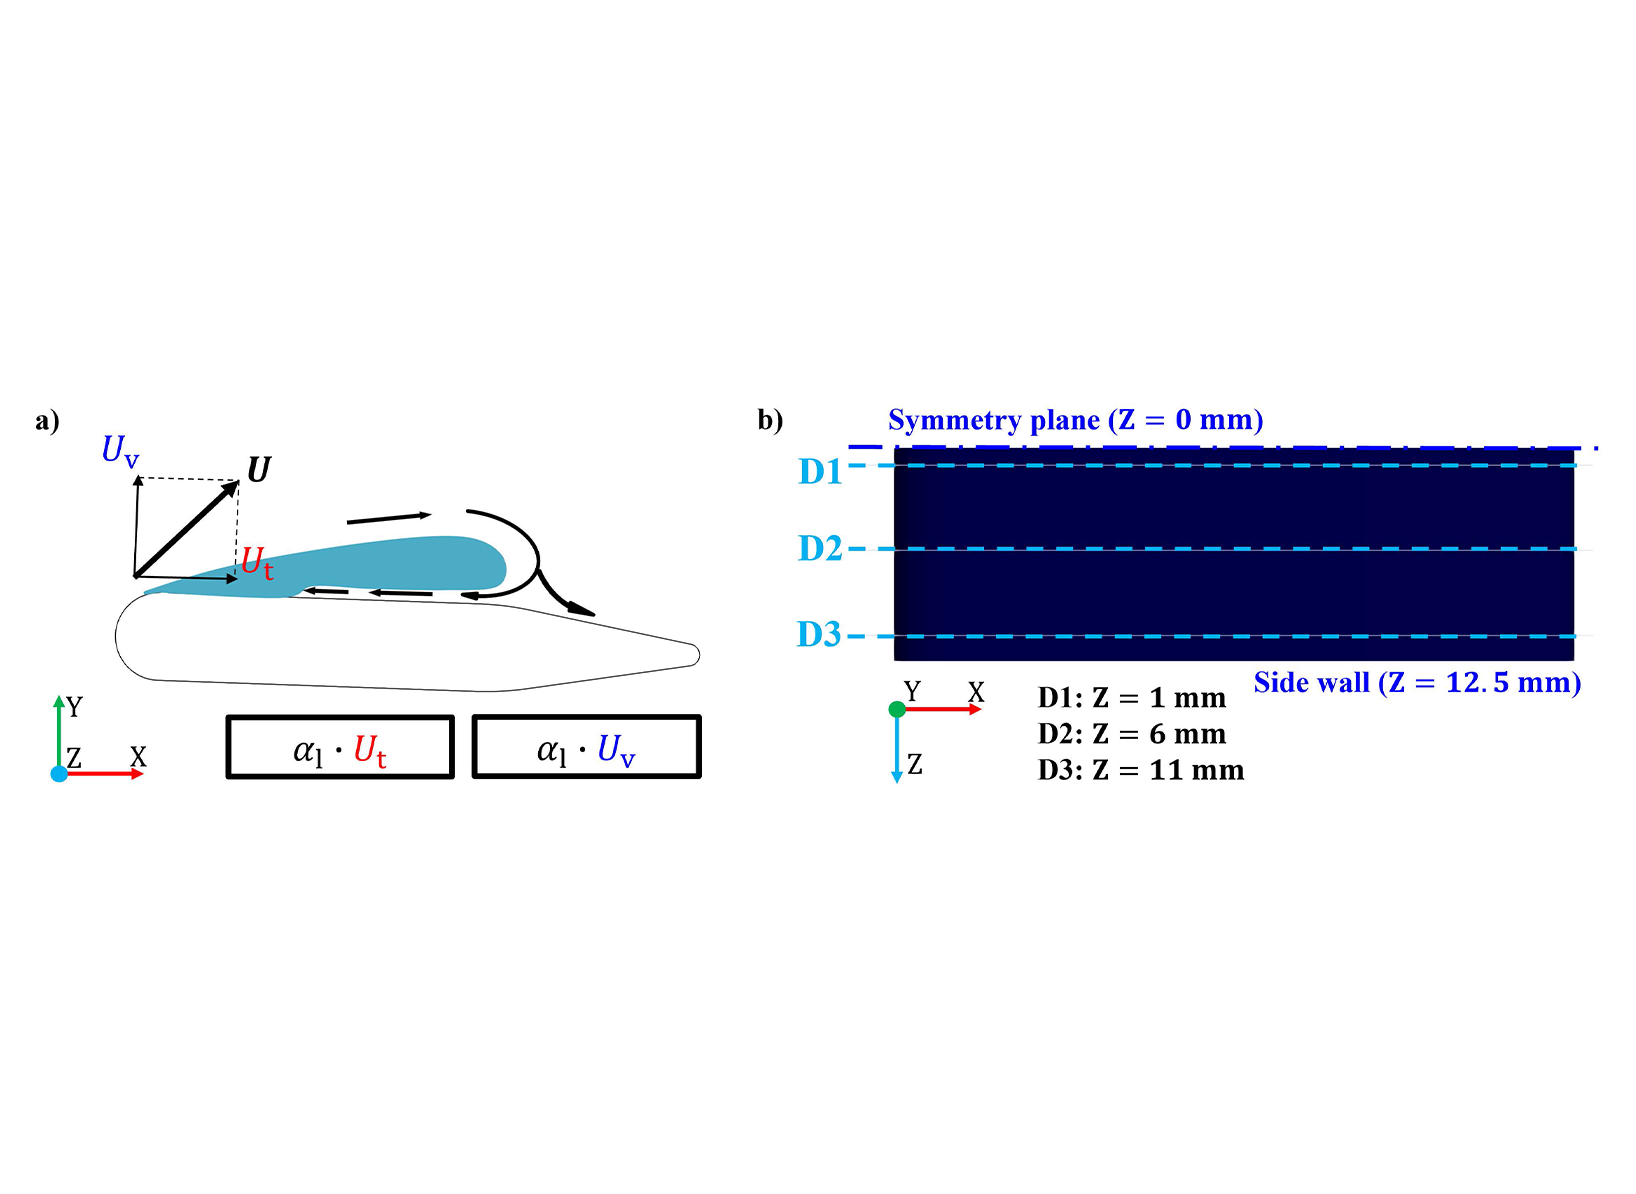 Figure 1: a) Side view on the hydrofoil with a scheme of the re-entrant jet and the indicators and . b) Top view with the location of cutting planes D1, D2 and D3 for postprocessing.
 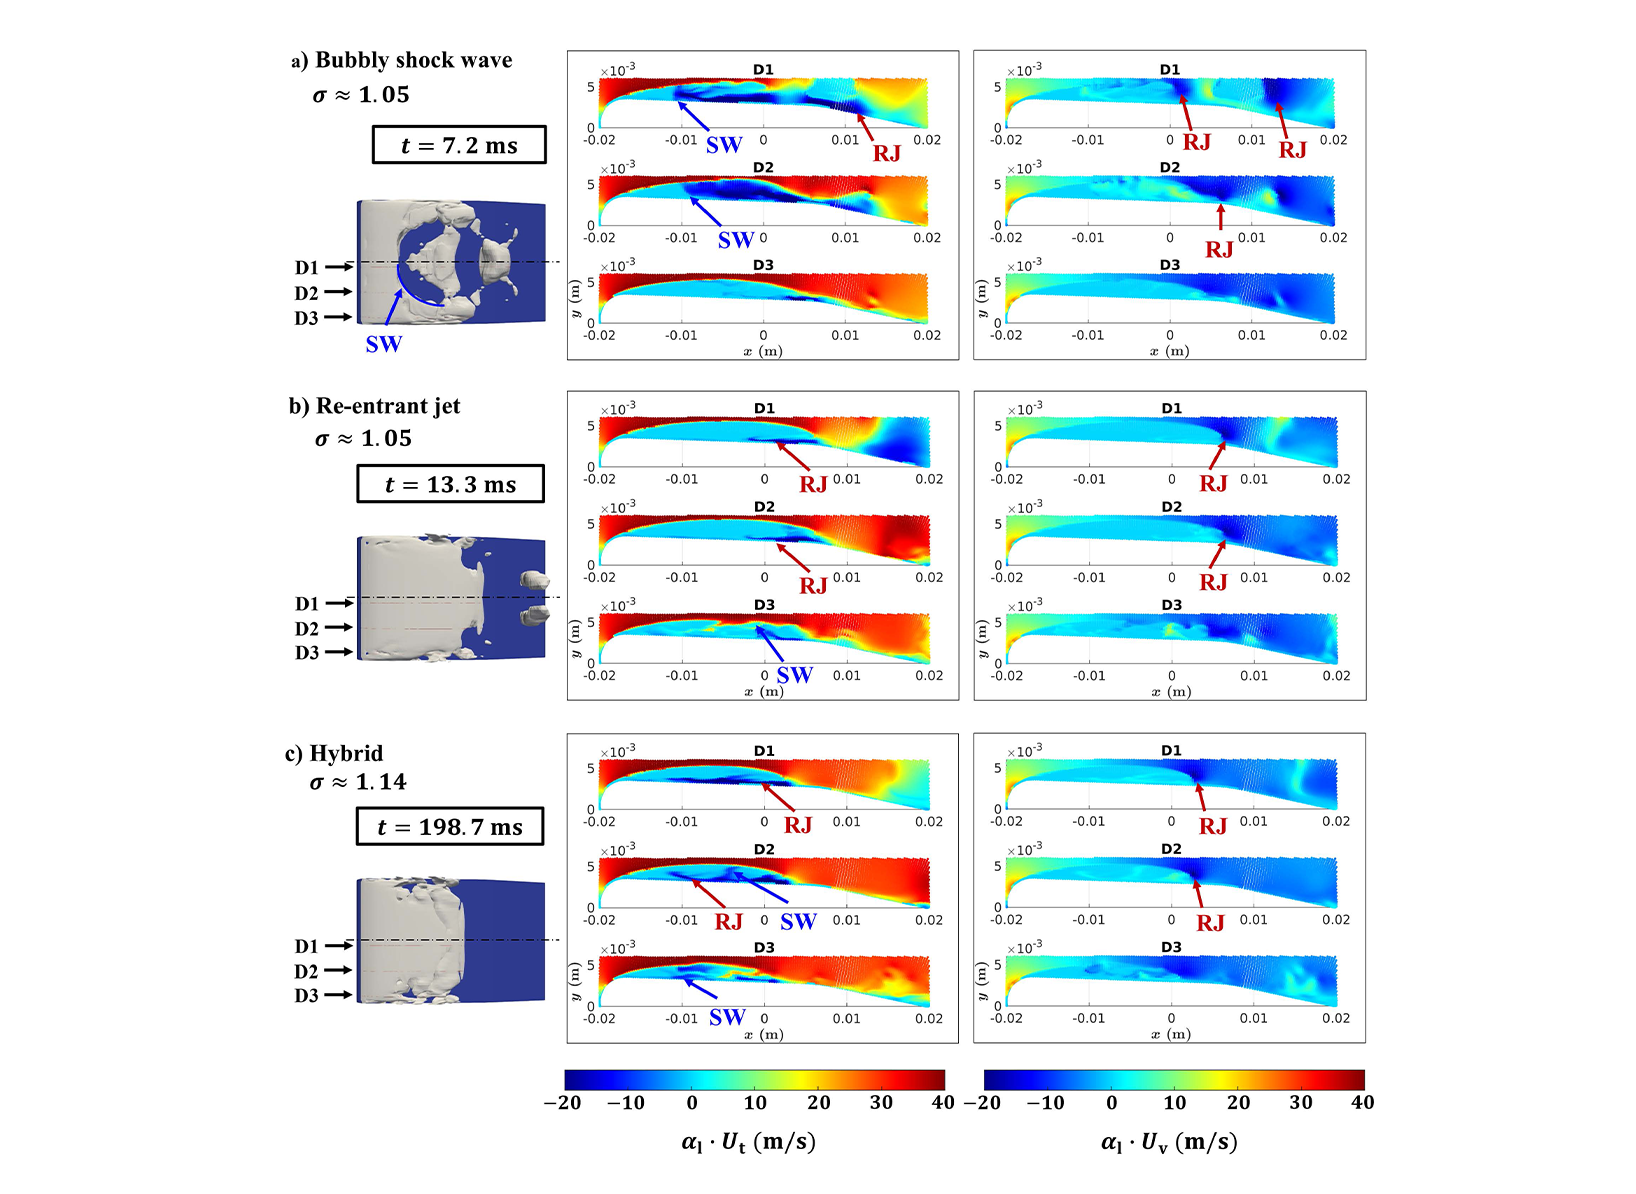 Figure 2: Synchronised representation of the global vapour development using an isosurface (left) and the local flow fields at the cutting planes D1, D2 and D3. To identify the re-entrant jet (RJ) and bubbly shock wave (SW), the fields of the indicators (middle) and (right) are shown. a) Bubblyshock- wave-dominated cycle, b) Re-entrant-jet-dominated cycle, c) Hybrid cycle.
 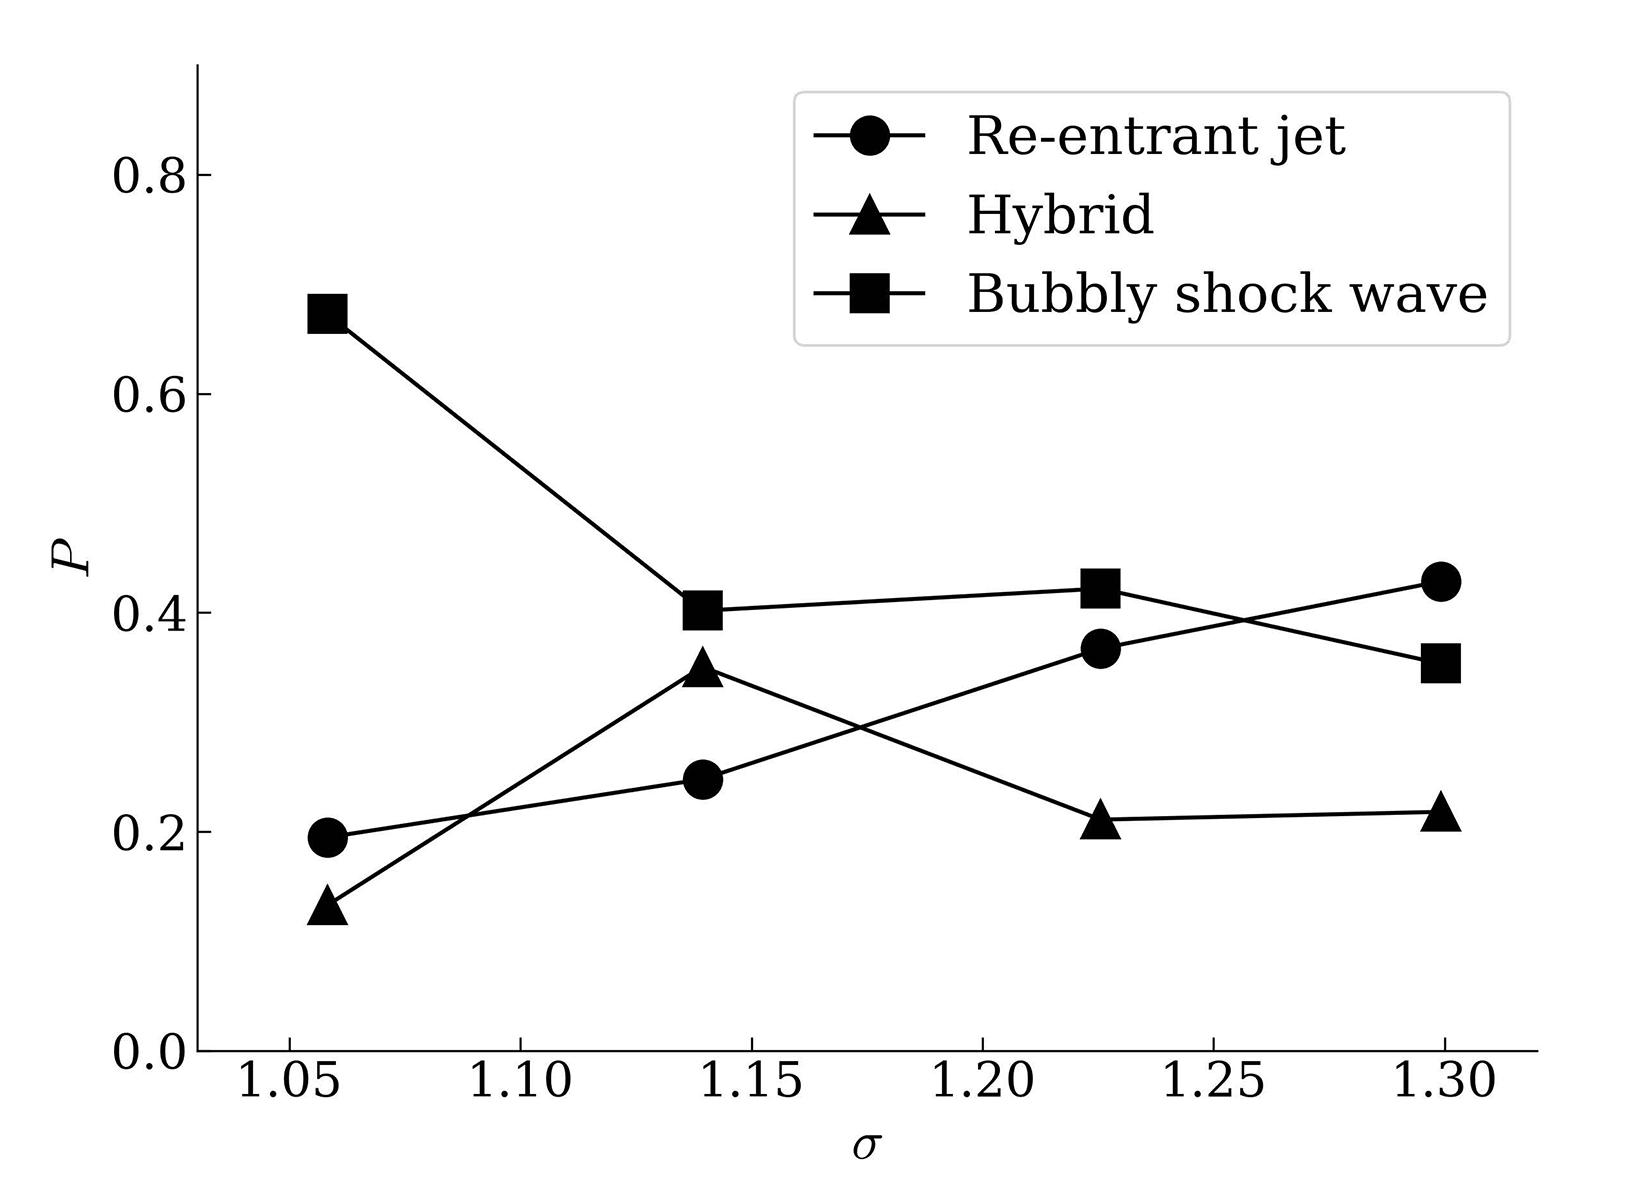 Figure 3: The probabilities of the re-entrant-jet-dominated cycle, the bubbly-shockwave-dominated cycle and the hybrid cycle are shown under a variation of the cavitation number. (Operating point: .)
 Hydrodynamic cavitation is a highly dynamic and complex phenomenon that frequently occurs in hydraulic fluid machinery such as pumps, marine propellers, and hydrofoils. It involves the formation and collapse of vapor cavities in a liquid due to local pressure drops caused by high flow velocities. In particular, unsteady cavitation structures, such as cloud cavitation, can lead to significant fluctuations in lift, thrust, and torque, as well as material erosion, noise, and vibration. Understanding the underlying mechanisms of cavitation shedding is essential for improving the reliability and efficiency of hydraulic systems. Capturing the intricate physical processes involved, especially which requires the accurate resolution of turbulence, viscosity, compressibility, and multiphase interactions. This makes high-fidelity simulations computationally intensive. Therefore, high-performance computing (HPC) is essential to conduct detailed numerical investigations that can provide deeper insights into the dynamics of cavitation.
Project Details
Project term
February 22, 2024–June 12, 2025
Affiliations
Ruhr University Bochum
Institute
Chair of Hydraulic Fluid Machinery
Principal Investigator
Methods
A fully-compressible implicit pressure-based homogeneous mixture approach is adopted, where both, liquid and vaporous water are compressible. The energy equation is not solved, but any fluid property is evaluated at 23.5 ◦C. A scale-adaptive simulation is adopted, and in addition, turbulent viscosity is locally reduced in themixture regime. A mass transfer cavitation model is used with bubble number density n = and nucleation site diameter . Surface tension as well as dissolved and free air are neglected. A combined PISO and SIMPLE cell-centred finite volume algorithm is used. Time is discretised with an implicit first-order Euler scheme. Due to very small time steps employed, we accept the first-order in this study. The convection term of the momentum equation is discretised by a limited central difference scheme, while a flux-limited van Leer scheme is used for the other equations. The liquid water volume fraction transport equation is solved with a bounded semi-implicit MULES scheme. The implementation is based on a customized compressibleInterFoam solver from OpenFOAM® version 9.
Results
Figure 1a schematically illustrates the formation of the re-entrant jet: The liquid phase recirculates around the vapour sheet cavity and impinges perpendicularly on the surface of the hydrofoil at the end of the cavity. Upon impact, the liquid jet is split into two parts: One part flows upstream beneath the sheet cavity and is referred to as the reentrant jet, while the other part follows the main flow along the hydrofoil surface. To identify the shedding mechanisms, the velocity vector is decomposed into a tangential component (index ‘t’) and a vertical component (index ‘v’). These components are each multiplied by the volume fraction of the liquid phase (αl). On the one hand, a pronounced negative value of below the cavity, confined to the immediate wall proximity, indicates a re-entrant jet. On the other hand, a negative value of along the entire wall normal extent of the cavity is assumed to indicate a shock wave. Another indicator for a re-entrant jet is a negative value of at the downstream end of the cavity, which facilitates the identification of a re-entrant jet occurring locally in a bubbly-shock-wave-dominated cycle. Both indicators and are evaluated within cutting planes D1, D2 and D3 at three spanwise locations, as shown in Figure 1b. Approximately 110 shedding cycles are analysed for each cavitation number. The outcome of the indicators and is demonstrated for three example instants of time in Figure 2. The view of the global vapour development is mirrored on the symmetry plane and the vapour is visualized using an isosurface of the vapor volume fraction () leftmost in Figure 2, while the local flow fields of the indicators and are shown in the middle and rightmost in Figure 2. In Figure 2a, b and c, a bubbly-shock-wave-driven, re-entrant-jet-driven and hybrid cycle are shown. The images in each subfigure are temporally synchronised. For the bubbly-shock-wave-driven cycle in Figure 2a, both, a bubbly shock wave (SW) and a re-entrant jet (RJ) are present. In the global vapour distribution (left image), the shock front is circular and is marked with a blue arrow. This bubbly shock wave can also be observed immediately by the indicator with a significantly large negative value over the entire height of the cavitation region, which is also marked with blue arrows. On the right of the bubbly shock wave, the local re-entrant jet can be observed in planes D1 and D2, which is marked with red arrows. As discussed above and sketched in Figure 1, the re-entrant jet can be identified by a synopsis of both indicators and . Although both mechanisms occur in this cycle, the bubbly shock wave is causative for the cloud separation. This cycle is therefore classified as a bubbly-shock-wave-dominated cycle. Even in the re-entrant-jet-dominated cycle in Figure 2b, a weak bubbly shock wave is evident in plane D3, but the dynamics are driven almost exclusively by the re-entrant jet, which can be clearly identified by a large negative value of confined to the wall proximity below the cavity. The shock wave lags behind the re-entrant jet, meaning that the RJ truncates the vapour sheet first, so that we identify this example cycle as re-entrant-jet-dominated. For the hybrid case shown in Figure 2c, the re-entrant jet is preferentially initially located in the centre of the channel near plane D1, while the shock wave is initially located close to the side wall near plane D3. Both mechanisms converge in the region of plane D2 and terminate the cycle simultaneously. This case is classified as a hybrid cycle due to the synchronous termination of the cycle by both, re-entrant jet and bubbly shock wave. Based on a visual inspection of a multitude of single cycles as described above, we adopt this illustration of probability P and add a third case in terms of the hybrid cycle, shown in Figure 3. The three probabilities sum up to a value of 1 for each cavitation number. The probability of the re-entrant-jet-dominated cycles increases with increasing value of σ, while the one of the shock-wave-dominated cycles decreases, which is in line with the observations in the literature. The probability of the hybrid case does not show a clear trend. In future studies, artificial intelligence tools may facilitate an automatic evaluation of cycles, and most important, experimental confirmation is indispensable.
Additional Project Information
DFG classification: 404-04 Hydraulic and Turbo Engines and Piston Engines
Software: OpenFOAM
Cluster: CLAIX
Publications
In review: Zhenhui Liu, Magnus Haese, Romuald Skoda (2025). Numerical 3D flow simulation of cloud cavitation on a hydrofoil induced by re-entrant jets and bubbly shock waves. IOP Conference Series: Earth and Environmental Science.